
OPAL-RING
Yoichi MIYAWAKI Laboratory
Visualizing Human Perception from Brain Activity Patterns
| Faculty/Department | Center for Frontier Science and Engineering |
|---|---|
| Members | Yoichi Miyawaki, Associate professor |
| Affiliations | Japanese Neural Network Society, The Japan Neuroscience Society, Vision Society of Japan |
| Website | http://www.cns.mi.uec.ac.jp/ |
As of August, 2015
- Yoichi MIYAWAKI
- Keyword
-
Neuroscience, Perception, Sensation, Vision, Touch, Neural network, Artificial intelligence, Medical engineering, Natural language processing, Brain-machine interfaces, Artificial limbs
Knowing what people are seeing from their brain activity
Miyawaki laboratory is a new laboratory, having started its research in 2012. The laboratory’s director, Associate Professor Yoichi Miyawaki, worked as a researcher from 2001 to 2006 at RIKEN Brain Science Institute after finishing his postdoctoral course at the University of Tokyo. He then moved to the Advanced Telecommunications Research Institute International (ATR), where he worked as a researcher from 2006 to 2012.
Associate Professor Miyawaki has started neuroscience research since his graduate school period. He worked on electroencephalography (EEG) to understand human visual systems. At his first workplace, RIKEN, he was involved in theoretical research that modeled brain activity. At his next workplace, ATR, he made significant achievement in a study of visual image reconstruction from human brain activity.
Previous research performing visual image prediction from human brain activity was based on classification, by which a brain activity pattern was classified into a limited number of stimulus classes that were predetermined by experiments. The typical procedure was as follows: they measured brain activity patterns while subjects were observing either “car” or “motorcyle” images, and trained a computational model that were able to learn difference in brain activity patterns evoked by images of each class. Then the model, or decoder, classified a new brain activity pattern into one of predetermined image classes (in this case, “car” or “motorcyle”).
Associate Professor Miyawaki and his colleagues took a step further to achieve a more ambitious goal. They tried to reconstruct arbitrary images, not restricted to predetermined ones, from brain activity patterns (Figure 1). In 2008, the team succeeded in reconstructing 10×10-patch visual images from human brain activity patterns (Figure 2).
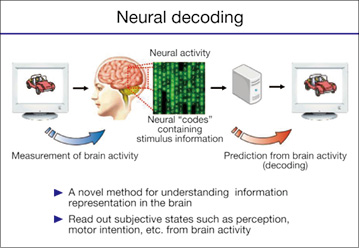
- Figure 1: Neural decoding. Neural decoding is a method to predict subjective states from human brain activity patterns.
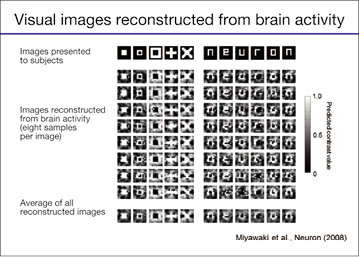
- Figure 2: Visual image reconstruction (Top row, images presented to the subjects; the second to the nineth row, images reconstructed from the subject’s brain activity patterns. Each test image was presented eight times. Reconstructed images were sorted by reconstruction accuracy from top to bottom. The bottom row is the average of all the reconstructed images. Each white and black patch in the test images corresponds to a high-contrast flickering checkerboard pattern and a homogeneous gray area in actual experiments, respectively. The predicted contrast is shown in gray scale.
Brain activity changes blood flow in the brain
Functional Magnetic Resonance Imaging (fMRI), a technique measuring blood flow changes in the brain, played a critical role in this research. fMRI has high spatial resolution, allowing us to observe blood flow changes with 3×3×3 millimeter resolution. Each of the cubic volumes is called voxel (Figure 3). The whole brain signals typically consist of about 200,000 voxels and it takes 2 - 3 seconds to scan them.
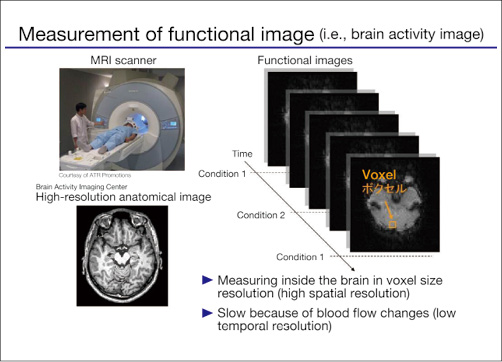
- Figure 3: Brain activity measurement with functional Magnetic Resonance Imaging (fMRI). fMRI signals consist of voxels, a 3×3×3 mm cubic volume, whose amplitude changes with local blood flow after neural activity in the corresponding brain region.
Neurons consume oxygen when activated. Then blood (or more precisely, hemoglobin in the blood) carries oxygen to the brain regions where oxygen is being depleted because of the neural activity. The change in the blood flow can be detected as fMRI signals.
The brain areas associated with visual functions are on the order of several thousand voxels. Associate Professor Miyawaki and his colleagues used fMRI signals from voxels in the visual areas and trained a computational model that reconstructed what a person was seeing. The model consisted of multiple decoders, each of which was trained to predict local image contrast. The whole image was able to be reconstructed by combining predictions from the multiple decoders.Based on this framework,Associate Professor Miyawaki and his colleagues succeeded in predicting more than hundred million images using the reconstruction model trained with brain activity patterns measured for a few hundred images.
What determines object recognition speeds?
Miyawaki laboratory is a young laboratory just in its second year. Nevertheless, they discovered clues leading to significant findings in following two research areas (Figure 4).
- Figure 4: The current research topics of Miyawaki laboratory.
One of the research areas is object recognition. It takes a certain amount of time from when a person sees an object until he/she recognizes what the object is. Is the time needed for recognition always the same? Or is the recognition time different according to the type of object or image? And if it is different, why? They are attempting to unravel these questions using brain activity measurements.
Interaction among the senses
The other research area is interaction among the senses such as touch, vision, and audition. The human brain processes sensory information in different brain areas dependent on its modality; for example, visual information is processed in the visual cortex located at the back of the head and auditory information is processed in the auditory cortex located at the both sides of the head.
People ordinarily recognize the world around them with their eyes. But how do the blind recognize the world? They use tactile and auditory information instead of visual information. Thus their skill for tactile discrimination using fingers is particularly superior to the normal, as shown in the ability of Braille reading (The Braille represents characters using a 3×2 grid of raised dots).
Recent research findings suggest that the visual cortex, which is believed to process visual information predominantly, can be activated by tactile stimulation as well as visual stimulation, for both the normal and the blind.
Miyawaki laboratory is trying to reveal mechanisms behind such interaction among the senses.
Another new research area for the laboratory is analysis of brain activity accompanied with limb movement.
Try to do it because we don’t know if we can do it
When Associate Professor Miyawaki first started researching visual image reconstruction from human brain activity, reactions from his colleagues were something like discouraged. Some opposed him outright; others were skeptical. Some must have thought his ideas were the stuff of science fiction. The research was indeed a series of struggles and hardship. The fMRI equipment they first used lacked sufficient resolution and the technology to analyze fMRI data was immature. Associate Professor Miyawaki said he thought about give-up of the project many times. But with assistance of higher-resolution fMRI equipment and the novel algorithm for fMRI data analysis his research collaborators developed , the team led the project to the goal successfully.
A cutting-edge research is pushing the boundary between what is known and what is unknown. In other words, you cannot be sure whether it will work or not before it is done; that is a good sign of an ideal cutting-edge research. Associate Professor Miyawaki says he wants to continue taking on cutting-edge research topics that others doubt as, “it is impossible”.
[Interview and article by Akira Fukuda (PR Center)]