As of August, 2015
| Faculty/Department | Division of General Education Graduate School of Informatics and Engineering |
|
| Members | Hidetaka Okada, Associate professor | |
| Affiliations | Society of Biomechanisms Japan, Society for Running, International Society of Biomechanics in Sports, International Society of Biomechanics, Japanese Society of Biomechanics, Japan Society of Physical Education, Health and Sport Sciences, Japan Society of Physical Fitness and Sports Medicine, Japan Society of Human Growth and Development | |
| Website | http://www.hb.mce.uec.ac.jp/ | |
Healthcare, Sports, Marathons, Long-distance races, Athletes, Biomechanics, Aging populations, Seniors, Running, Walking, Fitness
Japan is moving toward becoming a society with an advanced grey population. In 2005, the elderly (people 65 and older) accounted for 20.1 percent of Japan’s population, according to the Annual Health, Labour and Welfare Report 2013. In other words, one in five Japanese were the elderly. This percentage is forecast to reach 31.6 percent in 2030. Meaning roughly one in three people will be anelderly person. And the elderly are predicted to account for 39.4 percent of the population in 2055 and 39.9 percent in 2060. By this time, two out of every five Japanese will be the elderly.
How to maintain a healthy, long-lived population in the face of this advanced aging population is turning into a national issue. “Healthy” in this context is the ability to perform almost all activities of daily living (ADL) without assistance. And the most basic physical activity for the achievement of ADL is walking. Therefore, if walking ability can be maintained, we can generally assume a healthy life.
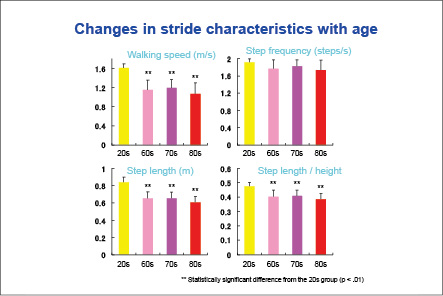
Associate Professor Hidetaka Okada’s laboratory is studying in detail how Japanese people’s walking ability and the gait motion change as they grow older. Walking speed is determined by the product of a person’s step length and the number of steps per unit time (step frequency). The big difference between the elderly and the young is their step length. The elderly have shorter step lengths than the young(see Figure 1). On the other hand, the step frequency barely changes between the elderly and the young. Therefore, the reason why people’s walking speed declines with age is on a shorter step length.
But why do people take smaller step length as they age? The Okada laboratory evaluates the motor ability of people’s lower extremity by the amount of joint torque of three joints. The three joints are the hip joint, knee joint, and ankle. The results of gait analysis show that ankle joint torque and the power was lower in the elderly than the young. In other words, the elderly have less strength to kick the ground. This is why they tend to shorten their step.
This finding leads to the possibility of developing numerical models of the standard gait motion for each generation by evaluating the joint torques and powers in the lower extremity. This, in turn, makes it possible to evaluate how old an individual’s gait motion is by observing his/her walking. Using this gait age, it would be simple to see if an individual ’s gait motion is good or poor for his/ her actual age. This of course necessitates measuring the gait motion of many subjects ranging all different ages and creating a database of the gait motion. The Okada laboratory is starting to measure gait motion for creating just such a database.
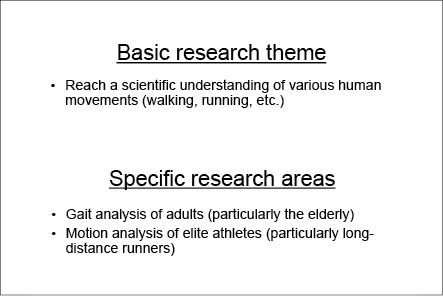
The section above covers one of the main research areas of the Okada laboratory: research that will explain the relationship between aging and gait motion (see Figure 2). Another main research area is investigating and clarifying the motion of athletes. The Okada laboratory’s primary theme, then, is understanding various physical movements of people both in daily activities and in sporting activities.
This section looks at research aiming to explain the movements of elite athletes. The laboratory puts much of its energy into researching the movements of long-distance runners.
It is well known that male runners from Kenya and Ethiopia dominate the world of full marathons. According to the 2013 marathon world rankings (released by the International Association of Athletics Federations (IAAF)), the top 40 runners were all Kenyans and Ethiopians. Looking at the top 50 runners finds one runner each from Eritrea (44th) and Morocco (49th). All the other 48 runners are from either Kenya or Ethiopia. The highest ranked Japanese marathoner is Kazuhiro Maeda, ranked 51st.
Why do Kenyan and Ethiopian men dominate marathon running? The Okada laboratory is studying differences in ability between Kenyan and Japanese long-distance runners. By studying the differences, we may develop knowledge on how to improve the ability of Japanese runners and even win a medal in the future.
Maximal oxygen uptake is an indicator that measures the endurance of marathon runners. This is a measure of how much oxygen the body consumes per kilogram of body mass per minute. The maximal oxygen uptake of an adult male (in his 20s) is about 40 milliliters. For elite long-distance runners, including marathoners, this soars to 70 to 90 milliliters. However, there is no difference in maximal oxygen uptake between top Japanese marathon runners and top Kenyan and Ethiopian runners.
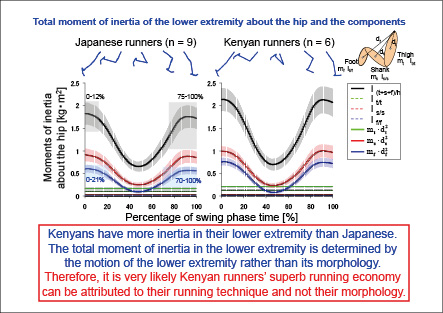
Seeing no difference in oxygen uptake, researchers began hypothesizing that a difference in running efficiencies was the answer. Attention focused on body shapes, particularly the shape of the shanks (between the knee joint and the ankle). Much of this attention arose because Kenyans, Ethiopians, and other top East African long-distance runners appear to have thinner shanks than world-class European and Asian long-distance runners. The logic was that a thinner (i.e., lighter) shank boosts running efficiency.
However, the Okada laboratory, in partnership with the Japan Institute of Sports Sciences and others, studied the body shapes and running forms of elite Kenyan and Japanese runners and found that although Kenyan runners did have long thin shanks, there were no differences in shank mass. Furthermore, results obtained suggest it is very probable that differences in running form, not differences in body shape, contribute to Kenyan runners’ high efficiency (see Figure 3).
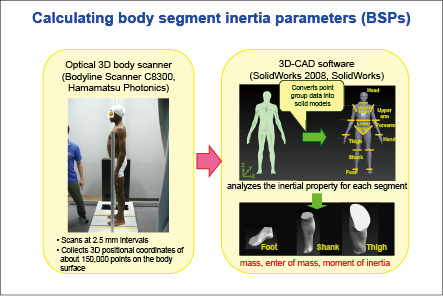
There are both commonalities and differences in the physical shapes and movement forms between ordinary people and athletes. Researching both gives the Okada laboratory an expansive perspective for its inquiries. While not described in detail here, in addition to scientifically measuring walking and running forms and creating an indicator for evaluating physical joint torques, the laboratory’s activities in measuring and analyzing body shapes with 3D data are also delivering steady results (see Figure 4). Painstaking measurements following strict procedural controls and analysis based on theoretical grounding are essential to bring sports, fitness, running, and other physical activities into the scientific and logical realm.
[Interview and article by Akira Fukuda (PR Center)]